Nicholas Boguth, CFA®

The Center Supports “Swing Fore the Cure” Golf Outing

Nicholas Boguth Contributed by: Nicholas Boguth, CFA®

Print Friendly and PDF

The Center was proud to sponsor the "Swing Fore the Cure" golf outing, a fantastic event involving raising money for a worthy cause and having a great time while doing it! The outing was organized by the family of the Center’s own, Nick Boguth, whose mother has been a significant fundraiser for the cause since becoming a breast cancer survivor 15 years ago.

Cancer is something that hits close to home for most of us as we all have colleagues, family, or friends who have been affected by the disease. The Center was happy to corral around this event, bring some of our Center energy to the golf course, and support the fundraising efforts that benefitted Ascension St. John Breast Cancer Center, Wigs 4 Kids, and Susan G. Komen Foundation.

Nicholas Boguth, CFA® is a Portfolio Administrator at Center for Financial Planning, Inc.® He performs investment research and assists with the management of client portfolios.

How Individual Stocks Are Performing So Far In 2021: We Are Exhausted

Nicholas Boguth Contributed by: Nicholas Boguth

Print Friendly and PDF

Picking individual stocks is a challenge. Many professionals dedicate their entire lives to the endeavor and still underperform the market. Look at these surprising numbers from the S&P 500 (representing the U.S. Stock Market) and its top 50 constituents.

Last month, the market as a whole was making all-time highs while a lot of individual names were lagging. As of 5/6/2021, the S&P 500 was at an all-time high (0% below its 52-week high), but 45 out of the top 50 stocks were not. If you had investments in some very well-known companies, you may have been 15% or more below the high point!

Investing in individual stocks is not for everyone. It can be a very high risk/high reward strategy; this past year is a great example. Contact your advisor if you’re considering this strategy.

This material is provided for information purposes only and is not a complete summary or statement of all available data necessary for making an investment decision and does not constitute a recommendation to buy, sell or hold a specific security. Investing involves risk and you may incur a profit or loss regardless of strategy selected. The S&P 500 is an unmanaged index of 500 widely held stocks that is generally considered representative of the U.S. stock market. Keep in mind that individuals cannot invest directly in any index, and index performance does not include transaction costs or other fees, which will affect actual investment performance. Individual investor's results will vary. Past performance does not guarantee future results.

How Risky Was It To Invest In Gamestop?

Nicholas Boguth Contributed by: Nicholas Boguth

Print Friendly and PDF
0309-NB-Gamestop.jpg

A quick Google search tells us that the odds of winning the Powerball Jackpot is roughly .000000003%. The odds of getting struck by lightning is roughly .0002%. What are the odds of getting rich by investing in a stock that grows by 100x in a year like Gamestop? Also slim.

It is hard not to envy those individuals posting screenshots of their LIFE-CHANGING gains like we saw last month with some of the lucky winners of the GME hysteria. The only problem is that it is far more likely that style of investing ends with life-changing LOSSES.

How often does a stock return 100x?

Christopher Mayer explored that question in his book, “100 Baggers”. His research found that 110 stocks returned 100x between 1976-2014.

Pair that with research from Credit Suisse and you soon realize that if your goal is to get rich quick, the odds are stacked against you. The number of listed securities has fluctuated from 3,000+ to 7,000+ over the past 50 years, and there have been OVER 15,000 new stocks listed in that time frame alone.

Some “back of the napkin” calculations would suggest that there is a ~0.5% chance you pick the stock that returns 100x, and that is assuming you hold through all the turbulence and sell at the correct time as well.

Back to the major problem – while 110 stocks returned 100x, there were THOUSANDS of stocks that failed. Some go bankrupt or get delisted because they never trade above $1/share, or lose 90% of their value and plateau. There’s a good chance a lot of those companies shared the financial position of Gamestop as well (Gamestop lost almost $500M in 2020).

So when we see a Reddit user celebrating their life-changing journey from $50k to $5M, know that there are DOZENS of individuals who tried the same thing – but are sulking in a less fortunate journey from $50k to $0.

At The Center, we believe in a more sustainable, long-term approach to gaining (and preserving) wealth. If you have questions about how that applies to you and your financial plan, please don’t hesitate to call or email anyone on our team.

Nicholas Boguth is a Portfolio Administrator at Center for Financial Planning, Inc.® He performs investment research and assists with the management of client portfolios.


Any opinions are those of Nick Boguth and not necessarily those of Raymond James. This material is being provided for informational purposes only and is not a complete description, nor is it a recommendation. There is no guarantee that these statements, opinions or forecasts provided herein will prove to be correct. Investing involves risk and you may incur a profit or a loss regardless of strategy selected. Prior to making an investment decision, please consult with your financial advisor about your individual situation.

Want to “Go Paperless” for Fund Prospectuses?

Nicholas Boguth Contributed by: Nicholas Boguth

Center for Financial Planning, Inc. Retirement Planning

If you’d prefer not to receive fund prospectuses by mail, there is a way to enroll in a paperless option.

Check the front of the envelope that you receive from Raymond James. It will have the instructions pictured below. There will be a box in the top right corner with a 20-digit number in it. Go to FundReports.com or call (866) 345-5954 and enter the 20-digit code.

1.png

From there, you have the 3 options below to choose from:

  1. “Go Paperless” – to receive the prospectuses by email.

  2. Receive a “Notice” – rather than the full prospectus, this will be a smaller piece of mail letting you know that a prospectus is available online if you’d like to access it.

  3. Receive a “Paper Report” – to continue to receive the full prospectuses by mail.

2.png

Having trouble?

If you are a current client or have a Raymond James account, please give us a call. If not, we suggest calling the customer service number on your statement or calling your financial adviser.

If you are interested in hiring a financial adviser, give us a call! The Center is a financial planning firm based in Southfield, MI that serves clients nationwide.

Were You In The Right Portfolio?

Nicholas Boguth Contributed by: Nicholas Boguth

Print Friendly and PDF
Center for Financial Planning, Inc. Retirement Planning

Talk about volatility…within 6 months, the S&P 500 hit an all-time high, fell over 33%, then climbed over 38%! As I write this*, we are almost back to an all-time high in the stock market.

I recently wrote about asset allocation as the single biggest decision you will make in your investing lifetime. There are many QUANTITATIVE factors that should go into your asset allocation such as your financial goals, time horizon, savings rate, liquidity needs, and return expectations (just to name a few), but there is a QUALITATIVE factor that stands out among the rest: how you feel about your portfolio.

Market crashes such as the one we experienced in March offer unique opportunities to reevaluate our portfolios; specifically the aforementioned “feeling”.  When the stock market fell 10%, then 20%, then 30%...how did you feel? Were you frantically watching the news worried about your financial future or comfortable in your recliner watching your favorite Netflix series? Were you checking your statements daily with rising blood pressure or confident in your advisor and financial plan?

Center for Financial Planning, Inc. Retirement Planning

Which asset allocation are you in? Mostly stocks, mostly bonds, or somewhere in between? Back in March, that single decision would have altered your stock market experience more than anything else, and it will continue to drive your experience going forward. If you are not confident in (or unsure of) your asset allocation, we’d love to help.

*Indexes above represented by: Bond – BbgBarc US Agg Bond TR, and Stock – S&P 500 TR. Return data as of 7/20/2020.

Nicholas Boguth is a Portfolio Administrator at Center for Financial Planning, Inc.® He performs investment research and assists with the management of client portfolios.


You cannot invest directly in any index. Pass performance doesn’t guarantee future results. Investing involves risk regardless of the strategy selected, including asset allocation and diversification. The S&P 500 is an unmanaged index of 500 widely held stocks that’s generally considered representative of the U.S. stock market. The Bloomberg Barclays US Aggregate Bond Index is a broad-based flagship benchmark that measures the investment grade, US-dollar denominated, fixed-rate taxable bond market.

When Stock Markets Fall 20%

Nicholas Boguth Contributed by: Nicholas Boguth

Print Friendly and PDF
When Stock Markets Fall 20% Center for Financial Planning, Inc.®

We are supposed to know that stocks are risky, but that doesn’t make holding onto them any easier during turbulent times like these. Hopefully this post provides some optimism for anyone invested in stocks, both domestic and international.  

What happened if you invested $1 in a stock market after it crashed 20% or more?

I took 15 stock indexes representing the largest economies in the world and found the date when they fell 20% from an “all-time high” like the U.S. markets did this past March. I counted 68 of these drawdowns in Morningstar’s database. Below is the performance of $1 over the 10 years following each drawdown.

This is a hypothetical example for illustration purposes only. Investors cannot invest directly in an index.

This is a hypothetical example for illustration purposes only. Investors cannot invest directly in an index.

In this example, blue lines ended positive. Red lines ended negative. $1 invested after a 20% drawdown turned positive 64 out of the 68 times. There were only 4 negative time periods (Hong Kong & Italy in ’73, Brazil & Italy in ’08). In the worst 10 year period, the index was down 28% and ended at $0.72. The best instances returned over 600%, and even all the way up to 1,100%!

The economy is tanking, should I get out of the market?

Every investor has thought about this question at least once, probably multiple times, during his or her lifetime. I’m not going to answer it for you here, because there is no universal answer. Investing is not one-size-fits-all. Time horizon, spending goals, cash flows, risk tolerance, and your entire financial plan will affect the decision. We work with our clients to ensure that they have a plan in place before it is too late. If you are unsure of your plan, or need to create one, feel free to reach out to us by phone, email, or on our social media.   

Source: Morningstar Direct. Indexes and dates shown below. Total return, monthly data.

Source: Morningstar Direct. Indexes and dates shown below. Total return, monthly data.

Keep in mind that individuals cannot invest directly in any index, and index performance does not include transaction costs or other fees, which will affect actual investment performance. Individual investor's results will vary. Past performance doesn't guarantee future results. Investing involves risk regardless of the strategy selected, including diversification and asset allocation. Holding investments for the long term does not insure a profitable outcome.

International investing involves special risks, including currency fluctuations, differing financial accounting standards, and possible political and economic volatility.

Nicholas Boguth is a Portfolio Administrator at Center for Financial Planning, Inc.® He performs investment research and assists with the management of client portfolios.


A free float-adjusted market capitalization weighted index that is designed to measure the equity market performance of developed markets. The MSCI World Index consists of the following 24 developed market country indices: Australia, Austria, Belgium, Canada, Denmark, Finland, France, Germany, Greece, Hong Kong, Ireland, Israel, Italy, Japan, Netherlands, New Zealand, Norway, Portugal, Singapore, Spain, Sweden, Switzerland, the United Kingdom, and the United States. With Net Dividends (Total Return Index): Net total return indices reinvest dividends after the deduction of withholding taxes, using (for international indices) a tax rate applicable to non-resident institutional investors who do not benefit from double taxation treaties. The S&P 500 is an unmanaged index of 500 widely held stocks that is generally considered representative of the U.S. stock free float-adjusted market capitalization index that is designed to measure the equity market performance of developed markets, excluding the United States & Canada. As of June 2007 the MSCI EAFE Index consisted of the following 21 developed market countries: Australia, Austria, Belgium, Denmark, Finland, France, Germany, Greece, Hong Kong, Ireland, Italy, Japan, Netherlands, New Zealand, Norway, Portugal, Singapore, Spain, Sweden, Switzerland, and the United Kingdom. (Total Return Index) - With Net Dividends: Approximates the minimum possible dividend reinvestment. The dividend is reinvested after deduction of withholding tax, applying the rate to non-resident individuals who do not benefit from double taxation treaties. MSCI Barra uses withholding tax rates applicable to Luxembourg holding companies, as Luxembourg applies the highest rates. The MSCI EAFE Index (Europe, Australasia, Far East) is a free float-adjusted market capitalization index that is designed to measure the equity market performance of developed markets, excluding the US & Canada. The MSCI EAFE Index consists of the following 21 developed market country indexes: Australia, Austria, Belgium, Denmark, Finland, France, Germany, Hong Kong, Ireland, Israel, Italy, Japan, the Netherlands, New Zealand, Norway, Portugal, Singapore, Spain, Sweden, Switzerland, and the United Kingdom. The MSCI Hong Kong Index is designed to measure the performance of the large and mid-cap segments of the Hong Kong market. With 43 constituents, the index covers approximately 85% of the free float-adjusted market capitalization of the Hong Kong equity universe. The MSCI Japan Index is designed to measure the performance of the large and mid-cap segments of the Japanese market. With 323 constituents, the index covers approximately 85% of the free float-adjusted market capitalization in Japan. The MSCI Germany Index is designed to measure the performance of the large and mid-cap segments of the German market. With 59 constituents, the index covers about 85% of the equity universe in Germany. The MSCI United Kingdom Index is designed to measure the performance of the large and mid-cap segments of the UK market. With 96 constituents, the index covers approximately 85% of the free float-adjusted market capitalization in the UK. The MSCI France Index is designed to measure the performance of the large and mid-cap segments of the French market. With 77 constituents, the index covers about 85% of the equity universe in France. The MSCI Italy Index is designed to measure the performance of the large and mid-cap segments of the Italian market. With 24 constituents, the index covers about 85% of the equity universe in Italy. The MSCI Canada Index is designed to measure the performance of the large and mid-cap segments of the Canada market. With 89 constituents, the index covers approximately 85% of the free float-adjusted market capitalization in Canada. The Russell 2000 Index measures the performance of the 2,000 smallest companies in the Russell 3000 Index, which represent approximately 8% of the total market capitalization of the Russell 3000 Index.

The Single Most Important Investing Decision

Nicholas Boguth Contributed by: Nicholas Boguth

Most Important Investing Decision Center for Financial Planning, Inc.®

Unsurprisingly, I think investing is fun. This is one of the reasons I’ve chosen a career in investment management. With that being said, my career is only 6 years in. Is it possible that I only think investing is fun because the stock market has hit a new all‐time high every single year of my career? Do stocks ever fall? Why even own bonds that pay 2% coupons?

With the decade being over, and the S&P 500 rising almost 190% over the prior ten years, it seems like a good time to remind ourselves of a few key investing principles.

  • Stocks are risky. Their prices can fall.

  • Bonds are boring, but they have potential to help preserve your portfolio.

  • Asset allocation is the single most important investing decision you will make.

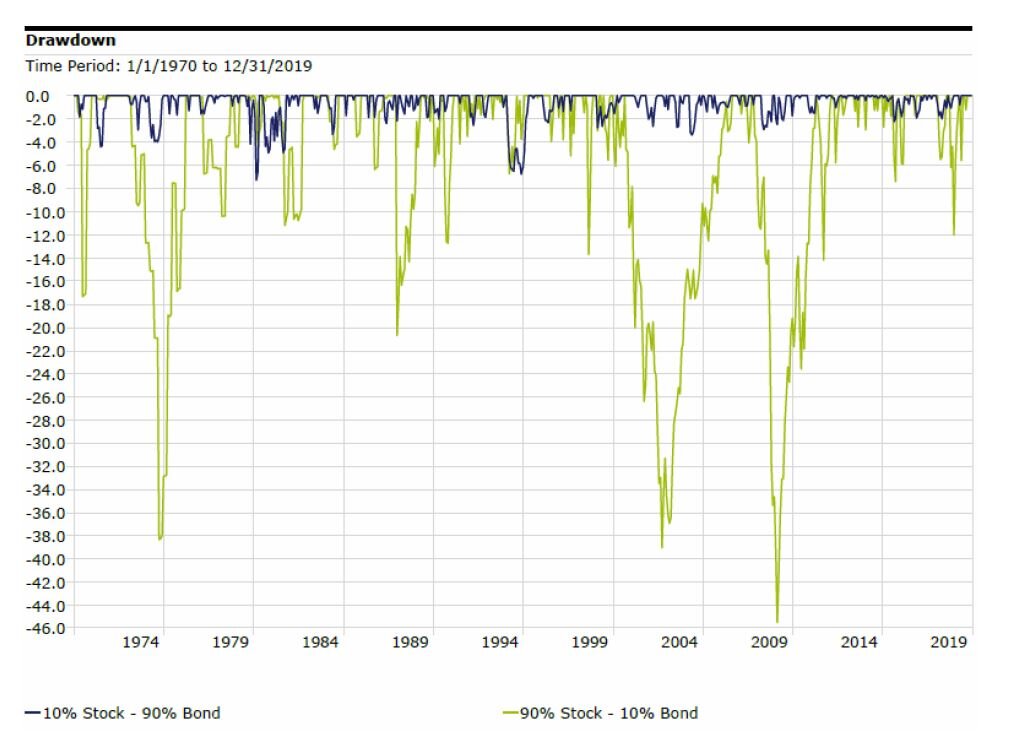
Asset allocation in its simplest form is the ratio of stocks to bonds in your portfolio. More stocks in your portfolio means more risk. More bonds in your portfolio means more potential to balance out the risk of stocks. As financial planners, one of the first decisions we’ll help you make is the decision of what asset allocation is most likely going to lead to your financial success.

Take a look at the drawdowns of a portfolio of mostly stocks (green line) compared to a portfolio of mostly bonds (blue line). Stocks may have roared through the 2010’s, but no one has a crystal ball to tell us what they will do in the 2020’s. This chart is a good reminder of what stocks CAN do. Be sure that your portfolio is set up to maximize your chance of success no matter what stocks do. If you are unsure about your current portfolio, we’re here to help.

Source: Morningstar Direct. Stock index: S&P 500 TR (monthly). Bond Index: IA SBBI US IT Govt Bond TR (monthly).

Source: Morningstar Direct. Stock index: S&P 500 TR (monthly). Bond Index: IA SBBI US IT Govt Bond TR (monthly).

Nicholas Boguth is a Portfolio Administrator at Center for Financial Planning, Inc.® He performs investment research and assists with the management of client portfolios.


Investing involves risk and you may incur a profit or loss regardless of strategy selected, including diversification and asset allocation.

The information has been obtained from sources considered to be reliable, but we do not guarantee that the foregoing material is accurate or complete. The IA SBBI US IT Government Bond Index is an index created by Ibbotson Associates designed to track the total return of intermediate maturity US Treasury debt securities. One cannot invest directly in an index. Past Performance does not guarantee future results.

Great Expectations

Nicholas Boguth Contributed by: Nicholas Boguth

Great Expectations Center for Financial Planning, Inc.®

We hear a lot about how stocks perform “on average”, and what to “expect” from stock returns:

  • “On average, stocks return x%.”

  • “You can expect stocks to return x% over the long run.”

  • “We expect stocks to return x% per year.”

But what to expect and what is average are two very different things. In fact, average happens so rarely, that I would almost never expect the average. Let’s take a look at some numbers.

Below is a chart of one-year rolling returns for the S&P 500 since 1936. Every spot on that line represents the prior 12 months of returns. As you can see, it is quite sporadic. The “average” return for this set of data is +11.9%, but it ranges from -50% to more than +61%!

Return data from Morningstar Direct

Return data from Morningstar Direct

When it comes to investing, realistic expectations are very important.

They keep us grounded and help us keep emotions out of the decision-making process. Don’t expect average returns every time you look at your stocks. Statistically speaking, since two standard deviations capture ~95% of data, it is safe to say you can expect somewhere between two standard deviations on any given period. If you are looking at one-year returns, that would be between -23% and +47%.

It is also important to remember your time horizon. Expectations over one year should be very different than expectations over 30 years. For reference, the entire range of 30-year returns for the S&P 500 since 1936 is between +9.1% and +14.7%.

S&P 500 TR index, monthly returns, 3/31/1936 to 10/31/2019

S&P 500 TR index, monthly returns, 3/31/1936 to 10/31/2019

Lastly, we need to remember that this is only one asset class. If you have a diversified strategy, there is a good chance that large U.S. companies only make up a small percentage of your strategy. International companies, small and mid-sized companies, various bonds, and alternative strategies all merit different expectations. As financial advisors, it is our job to help you understand what to expect. Not sure what to expect? Give us a call.

Nicholas Boguth is an Investment Research Associate at Center for Financial Planning, Inc.® He performs investment research and assists with the management of client portfolios.


Return data from Morningstar Direct. S&P 500 TR index, monthly returns, 3/31/1936 to 10/31/2019. Any opinions are those of Nicholas Boguth, Investment Research Associate, and not necessarily those of Raymond James. Expressions of opinion are as of this date and are subject to change without notice. There is no guarantee that these statements, opinions or forecasts provided herein will prove to be correct. Investing involves risk and you may incur a profit or loss regardless of strategy selected, including diversification and asset allocation. Keep in mind that individuals cannot invest directly in any index, and index performance does not include transaction costs or other fees, which will affect actual investment performance. Individual investor's results will vary. Past performance does not guarantee future results. Future investment performance cannot be guaranteed, investment yields will fluctuate with market conditions. The S&P 500 is an unmanaged index of 500 widely held stocks that is generally considered representative of the U.S. stock market. International investing involves special risks, including currency fluctuations, differing financial accounting standards, and possible political and economic volatility.

Even the Best Investors Lose Money

Nicholas Boguth Contributed by: Nicholas Boguth

Even the Best Investors Lose Money

In an ideal financial planning universe, we would only invest in things that go up. We would never see our account values go down. We would never even see a negative number on our statements. Bonds would pay interest, and interest rates would be so stable that bond prices didn’t move. Stocks would pay dividends, and every company’s earnings would only grow.

Unfortunately for us, investing is not that simple. There is no growth without risk. Nothing, and I mean NOTHING, is guaranteed to appreciate. Even the world’s best investors lose money from time to time, but what makes them the best investors is how they react when those losses happen.

Let’s take a look at Warren Buffett, one of the most successful investors of all time, and how his stock has done compared to the S&P 500 (a collection of the 500 largest public U.S. companies) over the past 25 years. Is it all positive? Does he beat the S&P 500 every year? If he did lose to the S&P 500, was it close? Would you stick with him for the following year?

Data: Morningstar Direct. Total Return.

Data: Morningstar Direct. Total Return.

What stands out to you? Two things jumped out at me:

  1. Both were negative five out of the past 25 years.
    Even one of the best investors in the world lost money the SAME number of times as the S&P 500.

  2. Buffett returned less than the S&P 500 nine times, and one of those times was by more than 40%!
    If you looked at your statement and saw that your $10,000 turned into $8,000, while everyone who owned just the 500 biggest U.S. companies now had $12,000, would you stick with Buffett or would you switch investments?

Investing is hard because of risk. Investments depreciate or underperform for years at a time. You can’t avoid this fact. One thing you can avoid is making decisions that ultimately may be harmful to your goals, by having a plan in place for those years when investments aren’t going the way you’d like.

Don’t have a plan? We would be glad to help.

Nicholas Boguth is an Investment Research Associate at Center for Financial Planning, Inc.® He performs investment research and assists with the management of client portfolios.


Any opinions are those of Nicholas Boguth and not necessarily those of Raymond James. This material is being provided for illustration purposes only and is not a complete description, nor is it a recommendation of any investment mentioned. There is no guarantee that these statements, opinions or forecasts provided herein will prove to be correct. Investing involves risk and you may incur a profit or a loss regardless of strategy selected. Prior to making an investment decision, please consult with your financial advisor about your individual situation. The S&P 500 index is comprised of approximately 500 widely held stocks that is generally considered representative of the U.S. stock market. It is unmanaged and cannot be invested into directly. Past performance is no guarantee of future results.

Holiday Online Shopping Scams

Contributed by: Nicholas Boguth Nicholas Boguth

20171212.jpg

Tis’ the holiday season, which means plenty of online shopping for a lot of us. For those of you who have been or will be online shopping for the holidays, we want you to take special care to avoid attempted fraud.

Most of these online shopping scams will come through your email in the form of a fake offer, receipt, or shipping notice.

The most important thing is to avoid clicking on anything that seems out of the ordinary, and if you get an offer that seems too good to be true – it probably is.  You may also see these “too good to be true” offers on social media, and they could even look like a friend shared it with you. In these cases, do some research before clicking, and avoid filling out personal information on non-reputable websites.

Protect yourself by shopping with a credit card; it is easier to deal with fraud if you ever do fall victim.

If you are emailed a receipt or shipping notice for something that you did not purchase, do not click the email. Instead, check your credit card transactions to see if this purchase actually did happen. If it did happen, contact your credit card company immediately to report the fraud.

This is also a good time to remind everyone to periodically change your passwords for online accounts, and be sure to use different passwords for different accounts. If possible, only shop at well-known online stores, or retailers that you have had success with in the past. Be on the lookout for anything out of the ordinary. If you do come across something you believe to be fraudulent, report it to the FBI’s internet crime complaint center (https://www.ic3.gov/default.aspx).

Keep these tips in mind and happy holiday shopping!

Nicholas Boguth is an Investment Research Associate at Center for Financial Planning, Inc.® and an Investment Representative with Raymond James Financial Services.


Third party links are being provided for informational purposes only. Raymond James is not affiliated with and does not endorse, authorize or sponsor the listed website or its respective sponsor. Raymond James is not responsible for the content of any website or the collection or use of information regarding any website's users and/or members.